
Teams could theoretically rack up "Massey-Thaler" surplus value with lots of bottom-round picks, but teams can only carry so many players. Rare exceptions aside, players from the top rounds are the ones that make a difference in the fortunes of a team. For every Tom Brady (6th round) there are several Mannings, Rivers, Palmers, Roethlisbergers, etc.
Let's compare total conventional draft values, M-T values, and their differences for each team for the first 3 rounds only, the "Day 1" picks. The rankings are listed below:
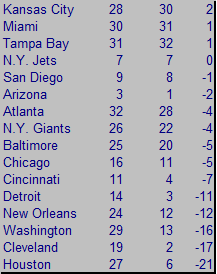 There are some exceptions, but we see generally successful teams at the top of the list and generally unsuccessful teams at the bottom. It's a rough analysis, but it leads me to believe there is some level of correlation between maneuvering for M-T surplus value and team success on the field. Keep in mind, bottom-feeder teams with the top picks have more M-T surplus value than winning teams with the later picks. Therefore, if there truly is a significant correlation between wins and M-T value, the direction of causation would be from M-T value to wins, not vice-versa.
"Day 1" Massey-Thaler Comparisons
published on 5/10/2007


Subscribe to:
Post Comments (Atom)