
 Last season you might recall a dust-up between Harvard evolutionary psychologist Steven Pinker and popular science author Malcolm Gladwell over whether teams really have any ability to predict which college QBs will pan out into good pros. You might be wondering what the heck a psychologist and a pop-science author have to do with NFL football.
In his book What the Dog Saw, Gladwell wrote about how hard it is for school administrators to discriminate the better teacher candidates from the lesser candidates. Gladwell used the NFL draft to illustrate how difficult it is for anyone to predict human performance, even in a sport where there is ample performance metrics and every step, throw, and catch is videotaped from 12 different angles. Gladwell was referring to what was reported by economists Dave Berri and Rob Simmons as a "very weak" correlation between draft order and per-play performance by QBs.
In an exchange of letters following Pinker's critical review of What the Dog Saw, Pinker took issue with Gladwell's claim that there was "no connection" between when a QB is taken in the draft and his per-play performance. Pinker wrote that this is "simply not the case."
As has been pointed previously, the problem with the weak correlation cited by Gladwell is that it excludes players who are not judged good enough by coaches during their development to warrant much if any playing time. At its core, the NFL draft is a process of selection, and we should expect selection bias will taint most attempts at analysis. Gladwell looked at the draft process and (correctly) said:
"Coaches and GMs turn out to be good decision-makers when it comes to drafting quarterbacks when you consider the fact that the quarterbacks who never played aren’t any good. And how do we know that the quarterbacks who never play aren’t any good? Because coaches and GMs are good decision-makers!”
But Gladwell's argument cuts both ways. The only way to see that coaches and GMs aren't any good at drafting QBs is to assume they're no good at choosing which QB on their roster to play in games!
In this post I'll attempt to settle the question of whether NFL scouts really have any ability to identify the better QBs. Do the QBs picked higher in the draft turn out to be better performers on a per-play basis? Is Pinker correct that they do, or is Gladwell correct that they do not?
A Deceptively Complicated Question
As I wrote in a recent post, it's a far more complicated question than it seems at first. Some QBs who had very few attempts can have very erratic per-play stats, which would distort the relationship between performance and draft order. We can use a minimum qualifying cutoff of attempts to eliminate the low-sample size problem, but doing so increases the selection bias. Plus, what do we do about the players who never played a snap?
Berri and Simmons' solution was to set aside the players who had fewer than 100 attempts and who never played, which is almost guaranteed to obscure any connection between draft order and performance. (Actually, Dave tells me he did not use a cutoff for one of his methods, which compared picks 1-10 with picks 11-50 and surprisingly showed that the 11-50 picks outperformed the 1-10 picks group. More on that below.)
Previous Research
My original solution was to replace the non-qualifying QBs' stats with those of the 5th percentile qualifying QB, which is quite low. I thought that these QBs were judged not good enough to play much if at all by coaches, but it would not be fair to assume they would be the worst of the worst. My choice of the 5th percentile was arbitrary but at the time seemed reasonable. Using this method, I found a very clear linear connection between overall draft order and per-play performance.
A few months ago, Dave Berri convinced me that the choice of the 5th percentile may be too low. I think he also accepts that his method is subject to a large selection problem. So the question becomes, what level of performance is the best estimate for non-qualifying QBs had they been given more opportunity?
An Improved Approach
One way to estimate the average expected level of performance from non-qualifiers is to temporarily set aside all the players who didn't play a single snap. Next, we can aggregate all the other non-qualifiers' performance into one collective level of performance. We can then assign this expected performance level to all non-qualifiers. We can also assign this level to all the QBs who never attempted a pass. It seems fair to say that these QBs could not be expected to exceed the performance level of the QBs who were given at least a few games worth of attempts. This does not yet account for any improvement that inexperienced QBs would undeniably make. But for now I'll wait to address that consideration.
Measuring Career Performance
To measure performance I used an era-adjusted career adjusted yards per attempt (AYPA). AYPA is yards gained per pass attempt with a 45-yard penalty per interception plus a 10-yard bonus for each TD pass. Average AYPA has increased steadily over recent years, so a small correction was made based on the mid-point of each QB's career. My sample included QBs drafted in the first seven rounds of each draft from 1980 through 2000. I stopped at 2000 to allow most QBs some time to establish a career performance level. 1980 was chosen to avoid the "dead pass" era of the 1970s, a time when passing stats were severely depressed. Before 1978, pass blocking and receiver contact rules gave defenses a strong upper hand in defending the pass. It was almost a different sport.
The weighted aggregate average AYPA for each pass in the sample was 5.71. In other words, this is the central tendency among all passes, not passers. The average AYPA for individual QBs in the sample was 4.46. The difference is because there are more bad QBs than good ones, but good QBs throw most of the passes. (This fact alone suggests coaches are good at identifying the better QBs on their teams.) The highest AYPA in the sample belongs to Peyton Manning at 7.00 AYPA.
Among qualified QBs, which I defined as players with at least 200 attempts (about half a season), the average was 5.17 AYPA. The aggregate non-qualifier average was 3.65 AYPA, which is based on over 3,100 passes. The standard deviation among qualifiers was 0.95 AYPA, so the non-qualifiers were, as a group, about 1.5 standard deviations below the average qualifier.
(As it turns out, my original guess two years ago of the 5th percentile was almost spot on. 3.65 AYPA actually corresponds to the 6th percentile!)
The Relationship between Draft Order and Performance
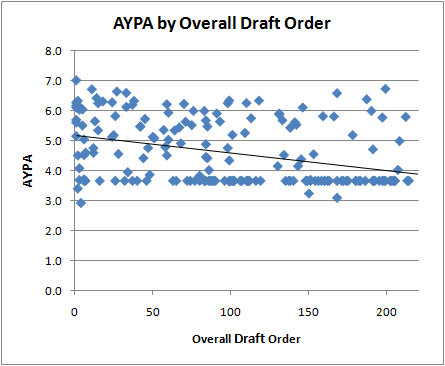
After replacing the non-qualifier QBs' stats with their aggregate stats, we can get an estimate, free of selection bias, of how draft order relates to per-play performance. Correlation coefficients can be deceiving, so I'll first just plot the data with a linear best fit line, and you can see for yourself. The first plot shows the relationship between AYPA and overall draft order. Notice how the number of non-qualifiers increases as draft order increases. For every slot higher in the draft a QB is taken, he could be expected to have 0.006 additional AYPA.
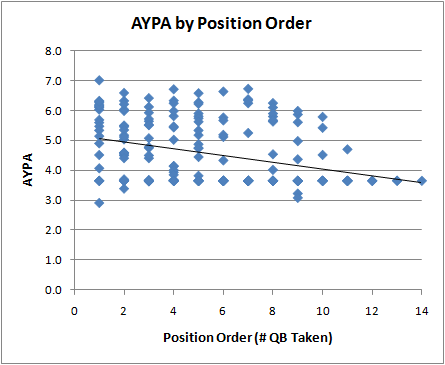
The next graph plots AYPA by QB position order (1st QB taken, 2nd QB taken, and so on). Again, there is a clear relationship. The higher the pick, the better the performance. For every QB taken there is an average expected difference of 0.11 AYPA.
And lastly, here is a third way to look at the relationship, by draft round. For every round deeper in the draft, there is a drop off of 0.19 AYPA.

Improvement of Non-Qualifying QBs
Many readers might not buy the 3.65 AYPA replacement for non-qualifying QBs. It's safe to say that these players would tend to improve over time if they weren't so bad in their initial outings. It's very difficult to say just how much they would improve, so let's attack the question from a different direction: How much would these non-qualifiers need to improve for there to be no connection between draft order and performance?
To find out, I gradually increased the replacement performance level from 3.65 AYPA until the linear best-fit line became horizontal, indicating no relationship. How much improvement did this require? 0.5 AYPA? 1.0 AYPA? Actually, these QBs would have needed to improve by a whopping 1.80 to an average of 5.45 AYPA! In other words, these non-qualifiers would have to improve by about two standard deviations--each.
That's the same as improving expected performance equivalent to 9 draft rounds (if there were 9). I can't prove that all these QBs couldn't improve that much given more practice and time, but it takes a stretch of the imagination to even ponder such an improvement, not just for one QB, but for dozens. And for every QB who perhaps doesn't improve, other guys would have to improve by even more. Below is what the relationship would have to look like. The "improved" non-qualifiers are the dense band between 5 and 6 AYPA.

Ok, I think I've made my point. To create a scenario where draft order is unconnected to performance, you'd need to believe that the non-qualifiers, who as a group actually performed severely worse than average, are actually slightly better than average passers.
A couple other caveats. Reader Jim Glass pointed out that if we're going to credit non-qualifying players with improvement, then we'd also have to credit longer-playing QBs for their decline due to age. Reader Alchemist pointed out that the utility of the very top passers may not be linear with respect to their performance. The very top passers may be worth much more than the second tier. In fact, now I think about it more, it's definitely the case. A QB who can improve his team's chances of converting a series by just a small amount could double his team's chance of scoring on any given drive. The rules and format of the sport dictate that the relationship between series conversion rate and probability of scoring is geometric (scroll down to 'A Simple Model' in the link).
I'm Lost. What Was the Question Again?
Still not convinced? Let's take a couple steps back and recall what we're really trying to find out: Do teams actually have any ability to tell the better QBs from the worse QBs? What teams really care about are the first few QBs taken. It's safe to say the top three QBs taken in a draft get ample opportunities at some point to play. There were only two 1st QBs, two 2nd QBs, and three 3rd QBs taken who did not qualify in my 21 year sample. Setting them aside, the 1st QB taken averages 5.45 AYPA and the 2nd QB taken averages 5.13 AYPA. The 3rd QB taken averages 4.84 AYPA, and from there it flattens out, likely due to selection effects. The difference between the 1st QB taken and 2nd QB taken equates to about 0.44 wins/yr (based on a linear regression of team stats and team win totals). With a 16-game schedule where the difference between perfectly average and playoff-bound can be 2-wins, half a win per year is considerable.
I think position order may be the best way to examine the abilities of teams to identify the better players. The problem with using overall pick number to compare QBs is that it doesn't do a good job of identifying just how good coaches, scouts, and GMs think the player will be. Overall pick number can have as much to do with team need as player ability. In 2008 Matt Ryan went #3 to Atlanta who had a big giant hole at QB. Joe Flacco, who was the consensus second best QB available, didn't go until 19, when the Ravens traded down then up to get him. But had the Ravens happened to have the #4 pick that year and the Ravens weren't able to trade down, Flacco might have been the fourth overall pick. Had the Ravens not traded up to #19, it's conceivable Flacco would have dropped into the late 20s. Overall pick number is only partially a reflection of coaches' estimates of player ability, and that's one reason we shouldn't expect a particularly strong proportional correlation in performance and overall pick number.
How Big a Correlation Should We Expect?
Although correlations can be tricky, I should note that after factoring in the aggregate replacement AYPA for non-qualifiers, the correlation coefficient between overall draft order and AYPA is 0.39. If we grant the non-qualifiers an entire standard deviation of notional improvement, the correlation is still 0.27. But is that good? Is it high or low? What does it say about the teams' ability to choose the better players?
Although there are some players so good they compel teams to take the player regardless of need, this isn't always the case. Some of the jockeying by teams trading picks on draft day has to do with overall talent level of the player they're targeting, but much of it is to get just in front of another team with the same need. As in the Flacco example above, there is an important unaccounted-for factor in where a player is picked overall--team need. That's going to add some degree of variance in a QB's draft order that will not correlate with player ability. This factor reduces the correlation coefficient between overall draft order and ability.
Overall draft order and career performance are both functions of many factors. A simple model might go like this:
Overall draft order = F(scout estimate of player ability, team need, importance of position, availability of great players at other positions, salary considerations)
Career performance = F(true player ability, offensive line, receivers, scheme, injury, sample error)
So the variance of those variables would reflect the same factors:
var(overall draft order) = var(scout estimates of ability) + var(team need) + ...
var(career performance) = var(true ability) + var(team factors) + ....+ interaction effects of all the above
If scouts really were pretty good, how much of all that variance can we really expect to be accounted for by the overlap of true ability and scouts' estimates of ability, considering all the other factors that intervene? That's what the correlation coefficient is trying to calculate, and it would be amazing if it were any higher than what we see here, about 0.27 or so. In the end, what scouts are doing is trying to predict human performance years into the future, performance that will be shaped by many more things than just player ability.
When we look at position order instead of overall order, we don't have to worry about much of what determines overall position: team need, importance of position, and availability of other great players. Of the top 3 QBs taken, which is what really matters to most teams, the 1st guy usually does better than the 2nd, and the 2nd usually outperforms the 3rd. I think if we're interested in scouts' ability to discriminate, position order is very informative because it's independent of team need.
Preemptive Rebuttal
Lastly, a few points of preemptive rebuttal. Dave Berri reports that in his data set, QBs picked 1-10 overall are outperformed by those picked 11-50 overall. (Without applying a qualifying cutoff.) My data (actually Pro-Football-Reference.com's data) shows the opposite. Between 1980 and 2000, picks 1-10 average 4.95 AYPA, and picks 11-50 average 3.71 AYPA. But that includes Mike Jenkins, who threw two passes, one complete for 5 yards and one interception for a -20 career AYPA! Matt Blunden had -8 AYPA on 9 attempts. Excluding those two unfortunate guys, the 11-50 average is 4.55 AYPA, better but still considerably lower than the 1-10 guys.
I'd also question the selection of endpoints at the 10th pick and at the 50th pick. Is there some meaningful practical difference between players on either sides of those fences? It may be that random fortune in Dave's data, which includes the 1970s, make the results appear to give the edge to one group or the other. In other words, if we move the cutoffs from the 10th pick to say the 12th pick, and the 50th pick to say the 45th pick, would Dave get completely different results?
Berry and Simmons used a larger data set, but not necessarily a better one. As mentioned above, including the 1970s "dead pass" era may confuse the results of their analysis.
I should also note that Berry and Simmons' measure of performance is different. They use a 'wins created' metric based on a linear regression of team stats. The only practical difference between our respective measures of performance is that they include running data, which I do not include. Could this make a difference? It might, but running is important to only a small fraction of QBs, and many of the recent running QBs, such as Vick, Culpepper and McNair, were top picks. So even if running made much of a difference, it's not clear which side of the analysis it would favor.
In the end, I'm convinced that once the selection bias is accounted for, there is an unmistakable relationship between draft order and career per-play performance, a relationship we shouldn't expect to be that large anyway.
Addendum: Dave Berri responds here.


Great stuff, I think the way to look at it by draft order and not round or pick is the key to determining a relationship between success and draft pick.
Not sure how hard this would be but I would be very interested to see the same kind of stuff for RB's and WR's.
That's a very well reasoned and logically supported argument, which is certainly more than Mr. Igon Value deserves.
Excellent post. The correlation results are impressively high, especially considering that top picks tend to play for bad teams and start earlier (i.e. before they have learned the playbook and been given time to develop).
I also want to second that the utility of the very top passers may not be linear with respect to their performance.
The article was actually published in December 2008.
www.newyorker.com/reporting/2008/12/15/081215fa_fact_gladwell
Very nice analysis. Still, I'd much prefer to sidestep the issue of selection bias altogether by simply looking at career value. Take era-adjusted AYPA for each QB in the data set, subtract 5.17, and multiply by their career attempts. Then you can do all the correlation tests on that approximation of career value.
That removes any need to try to approximate the performance of players, because you're using their actual performance. And this internalizes Alchemist's important point that a better player isn't better by a linear amount. As you note, the better players get to throw more passes, and this is accurately reflected in their inflated career values.
You bring up an interesting question - how good are coaches at picking the 'better' player.
It should be possible tease out some data on that correct? The method that I would consider is looking at teams that have had to change quarterbacks mid-season or perhaps just changed QBs due to injury.
Perhaps the sample size is too low to be definitive - but it could be suggestive.
Great work as per usual. I wonder how much the lost QB decade of the 90's (well to 98 really) actually make the later picks appear better. You had 96 and 97 where the only 1st rounder was Jim Drunkenmill and outside of 95 Jeff George was the second best QB out of the 13 picks between 90 and 97.
While an organisation uses a pick to select a QB, what they are really giving up is a proportion of available salary. How does QB performance relate to the rookie salary?
Also, assuming there were no barriers to aquiring a QB in the free agent market, how does the expected return of selecting a QB in the draft compare to aquiring one in free agency?
EdBed.
I think that the most important thing to consider with draft order is the cost that you have to pay and the opportunity cost of what you are passing up. If a quarterback is more expensive and less likely to succeed than a player at another position, than it makes more sense to take a player at another position. If a quarterback taken in the second round is only slightly less likely to succeed than one taken in the first round but costs only half what a first rounder does, than it makes sense to take a quarterback in the second round. From what I have seen, non-skill position players chosen in the first round are much more likely to have long careers in the NFL than skill players. They also cost less in monetary terms.
There are several confounding factors that might complicate any analysis of draft order. Teams have a great deal invested in a first round pick, and so they are more likely to spend a great deal of time coaching and working on conditioning with them. A later round pick is more likely to bounce around between teams and have to learn multiple systems. It is difficult to account for all of these factors in a statistical analysis.
Improvement of Non-Qualifying QBs: couldn't you get a fair approximation of this improvement by measuring the improvement of qualifying QBs over time? Logically the non-qualifiers would probably not improve as much. A lot of commentators think there is a steep learning curve which, if true, might result in great improvement with experience.
While I definitely agree that top picks who play terribly tend to be given more playing opportunities than terrible QBs who are undrafted or picked late in the draft, this mainly gives them a chance to pile up more negative career value. I don't think it follows that QBs picked late in the draft and lose their jobs relatively quickly were denied a fair chance to blossom.
If a player can play, they eventually find their way to a situation where they get a chance. Guys who are decent hang around the roster and eventually get their chance. Look at Rich Gannon's career arc. Heck, look at Kurt Warner's career arc! Neither of these are really arcs, but that's sort of my point.
Actually, the case of Kurt Warner raises an interesting point - perhaps all the undrafted players who've made a roster should also be included as "8th round" players? Warner is the obvious standout here, but a quick search reveals that Jake Delhomme and Jeff Garcia were also undrafted. Are there any other prominent UFA QBs of the last 30 years?
(Of course, this re-creates the selection bias issue again; i.e. only promising UFAs make it off the practice squad. Trying to account for these players may be more trouble than it's worth, but if you want to really conclusively show that QBs are worth high draft picks, the UFAs should probably be included in some way.)
I realized Tony Romo was undrafted, too. Romo and Warner... I mean, it's hard to ignore this completely. I realize Romo is out of the time frame of the data set, but when two of the top 5 career AYPA QBs were undrafted, it makes it difficult to act as though undrafted players don't belong in an analysis of the utility of using high picks on QBs. (And Garcia and Delhomme are in the time frame of the data set, along with Warner.)
I would speculate that there are probably many years when the best potential NFL quarterback available isn't drafted and never gets a chance to play in the league. There is actually a fairly large pool of candidates that meet the minimum physical requirements to play the position. The differences between successful and unsuccessful NFL quarterbacks seem to lie largely in mental factors, and these have proven to be very difficult to evaluate and predict. There are almost certainly quarterbacks out there who would have potentially had Hall of Fame NFL careers who never made it to the league because they played for terrible teams in college. Kurt Warner might still be working in a grocery store.
A very small percentage of draft picks come from schools with a losing record, even though they may be very good players. And success in college football is certainly not a sure predictor of success in the NFL, but is a lack of success in college football a sure predictor of a lack of success in the NFL? I'm not sold on the idea that it is. The problem is that in a sport like football, your success depends to a great degree on the team around you. A potential All-Pro quarterback with a poor left tackle and receivers who can't run routes can look like a dog.
brian-
well-executed post as always. just wanted to pass along these 2 graphs of career AV and draft position for all players drafted between 1994-2005 (the first is by pick number, the second is by round):
http://assets.sbnation.com/assets/340848/draft_performance_by_pick.jpg
http://assets.sbnation.com/assets/340852/draft_performance_by_round.jpg
obviously, i put this together for a non-stat-savvy crowd over at Niners Nation, so methodological rigor wasn't a major priority. i get that there are a myriad of ways to improve validity for this particular bit of research.
but my point of passing this along is 2-fold:
1) it's to say that your general finding in re how expected career performance decreases as the draft progresses probably generalizes to nearly all positions, not just QB; and that positions likely differ in the FORM of the decrease (e.g., linear vs. non-linear) more than they differ with respect to the EXISTENCE of the decrease. if this inference is correct, that would pretty much blow gladwell's generalized teams-can't-select-for-high-career-performance assertion out of the water.
2) it's also further to say that another way it's pretty clear teams are doing some amazingly reliable prediction of expected career performance is to compare the first graph i linked above with the i link to below, which shows the structure of rookie salaries by pick number in 2005 (research by mcdonald mirabile):
http://assets.sbnation.com/assets/340864/rookie_salaries.jpg
so, the function that explains the pick-dependent decrease in rookie salaries is of nearly the identical form as the one that explains the pick-dependent decrease in expected career performance for rookies. obviously, someone's doing something right if salaries can be so accurately mapped onto a prediction of performance for a career that hasn't started yet.
I had a similar thought to Danny T.
To avoid the selection bias problem why not compare the success of a QB relative to draft position against other positioin. You could use career starts to compare This would answer the question are nfl teams better or worse at selecting QBs than other positions.
Admittedly other positions have the advantage that non-starters get a lot of playing time relative to backup QBs.
I've already done something like that.
However, using career starts/pro-bowls/etc is a problem because those measures are affected by opportunity. Top picks are going to get more starts than they probably merit because of their draft status. JaMarcus Russel is a prime example. That's one reason why per-play performance needs to be part of the analysis.
Brian -
Might you consider a stufy along the line sof "How good is this organization at drafting"?
Obviously the organization needs to be stable (i.e. the same GM and coach) since organizatiosn change over time.
Are the Stealers, Patriots, Colts above average in the value of their picks, compared to the league (factoring in draft position, since these teams don't pick in the top 5 too often)?
I agree with Jeff a few posts above:
>>I would speculate that there are probably many years when the best potential NFL quarterback available isn't drafted and never gets a chance to play in the league.
Brandon in New York
P.S. I am more than disappointed the Jets threw away Leon Washington, I am mad. :-(
Brian, I hate to sound like a broken record, but your explanation why counting stats are a poor measure doesn't hold water if we subtract out the baseline. Starts is a bad measure, but only because there's no baseline to correct for.
But on the other hand, something as simple as:
yards - (attempts x 6.5)
...doesn't make Jamarcus Russel look good - it makes him look terrible. And if you use Adjusted Yards in stead of raw yards, he's even worse.
Great post, Brian.
One question -- did you treat draft pick as linear? It looked to me like you did, which might bias the results. Draft slots aren't linear -- the difference between the 1st pick and the 10th pick is much greater than the difference between the 101st pick and the 110th pick.
I started having this issue whenever I wanted to run regressions or correlation coefficients against draft order, so I made a post where I created a draft value chart (click my name). What would happen to your results if you used those numbers on the X-axis instead of draft order (i.e., making the 1st pick equal 73, the 2nd pick equal 64, the 3rd pick equal 59, etc.)? I suspect you the CC will be even stronger.
Thanks. Yes, linear. Logarithmic might be a better fit. But if you look at the original post from a couple years ago, the graph looks very linear for per-play AYPA.
Yes, I agree with all who say that per-play is not the sole measure of a QB. Total stats have meaning. However, totals will always favor 1st round picks because they get more opportunities to play. I was trying to account for that, plus the debate between Pincker and Gladwell was over per-play stats.
Dave Berri will post a response to this post soon by the way.
Chase-
See my comment above for gaphical support of your non-linear value proposal. I used your guys' Career AV numbers (to be able to include all positions) and found value decreases logarithmically with each pick, and also with each round (as Brian alludes to above). The logarithmic trends fit the data way better than did linear ones. Hence, your problems with linear correlation coefficients.
Brian-
This may come off as nit-picking, but I assure you I only bring it up because I've noticed a to-be-commended commitment to methodological rigor in your work...
Are you familiar with Derek Stimel's (2009) paper on structural shifts in the 4 QB Rating components over time? I'm wondering because it would seem his findings might affect the way you both choose and adjust for passing "eras." As per-pass averages, the 3 components of AdjYPA (YPA, INT rate, and TD rate) have each had different "eras," and YPA (arguably the most basic component of AdjYPA) has actually only had 1 era dating back to 1960.
The situation's complicated even further related to these components when you consider eras for their means are different than eras for their standard deviations. Although, the differences between SD eras for each component are more straightforward than differences between mean eras(aka SD era is pretty much 1977-present for each component, whereas mean eras are all over the place between components).
Like I said, probably nit-picking, but worthwhile to bring up nonetheless I think.
"However, totals will always favor 1st round picks because they get more opportunities to play."
That's DEFINITELY true for raw counting stats. That's ARGUABLY true for totals above "replacement level". But it's NOT true for totals above average. When you use totals above average, the Heath Shulers and Tim Couches and JaMarcus Russels just get a chance to accumulate more highly negative totals.
I appreciate that you were trying to address the specific Gladwell/Pinker debate, but using the counting stats and subtracting out the average seems like the most elegant way to deal with the small sample sizes of washout QBs.
On an unrelated note, why did you choose to use AY/A and not ANY/A? We have sack yardage data for the entire data set you're using.
I see what you were saying. Interesting point.
The PFR draft db doesn't have ANY/A handy. I would have needed to spend a prohibitive amount of time looking up the net YPA for each QB individually.
JaMarcus Russell, #1 overall pick in the 2007 draft, is about to be cut by the Raiders, says ESPN.
Is it really true that top draft picks have inflated career statistics just because teams play them more, just because they are top draft picks? That argument has always seemed exaggerated to me, and this seems evidence of the fact.
OTOH, this is also evidence that the correlation between position in draft and quality of player isn't the tightest of all.
(Although it might be tighter when non-senile team owners manage the picking, though perhaps I shouldn't digress into that.)
@Jim - Wouldn't the fact that Russell kept playing last year despite it being clear to most everyone that he was way over his head actually be proof that they get second and third chances. Anyone that wasn't the number 1 overall pick would have lost his starting job long before russell did. Now think about if russell was only moderately incompetent - maybe only 1 standard deviation worse than an average qb instead of about the 5 that russell is. He would probably still keep is job as well. I think russell is a great example of top picks getting more time not less.
Also great writeup brian!
I'm not sure that per play performance is the right performance measure for quarterbacks. Teams in need of a quarterback hope to find someone who will lead the team to the playoffs. I found a list of starting quarterbacks for all 460 NFL playoff games from 1939-2009 at http://en.wikipedia.org/wiki/NFL_starting_quarterback_playoff_records this gives 920 QB starts started by 195 quarterbacks. I paired this list with data from the NFL draft.
About 40% total number of starts came from 64 quarterbacks drafted in the first round. 42% of all wins came from these 64 quarterbacks. Of the 27 quarterbacks that started 10 or more playoffs games 15 were from the first round. As I looked over the list is appeared that if you want to get a quarterback to lead your team to the playoffs, the 1st round gives you the best chance. If that doesn't work, then undrafted free agents are your next best bet (11% of playoff quarterback starts were by 35 undrafted quarterbacks.)
Another way to look at this is total games started. If you look at quarterbacks who started 10 or more playoff games (25) 13 were from the first round and 6 from round 5 or later.
Other ways of slicing the data show pretty much the same thing. Get a franchise quarterback in the first round or wait for very late rounds or undrafted free agents. If you're looking at late rounds you're hoping to find someone like Tom Brady (18 starts), Roger Staubach (17 starts), Bart Starr(10 starts), Kurt Warner (13 starts), Warren Moon(10 starts) or Jake Delhomme (8 starts).
Another way to look at value of 1st round QB.
136 QBs were drafted in the first round 64 (47%) of them started at least 1 playoff game. (677 total QBs were drafted or signed as undrafted free agents. This total is probably off by a few because of AFL, USFL, and CFL QBs). So no matter how you look at it, the best place to find a QB to lead your team to the playoffs is in the first round.
Les
Brian:
Any word on when Berri will post his reply?
Not sure, but he has kept me up to date. He had a prior commitment to do something on JaMarcus Russell for another site first.
I think one potential noise source is that you are comparing a quarterback chosen, say, 9th in one draft with one chosen 14th in a different year. The vast difference in quality between years, and the annually differing needs of drafting teams, will surely add a ton of noise to this.
What if you analyzed all quarterbacks in the same year, in the order they were drafted in? Do earlier choices perform better than later ones in the same draft?
That might give cleaner data and a better indication of scouts ability to rate QBs.
http://bigthink.com/ideas/17381