
INTRODUCTION
Over the past few weeks, I've been interested in the amount of luck in NFL outcomes. I was interested primarily because I wanted to know just how good a game prediction model can get. In other words, what's the theoretical best that a prediction model can do? 70% correct? 95% correct? I think I've stumbled upon the answer.
The very best computer models predict winners at only a 70-75% rate. But that's not saying much because a monkey could predict winners 50% of the time. A monkey who knows which team is the home team could be correct 58% of the time. Even the Las Vegas odds makers aren't much better. They're correct less than 65% of the time.
It got me thinking. If a team is the very best team in the NFL, why wouldn't it have a 100% chance of winning each game? Why aren't there lots of 16-win teams? I thought that there must be good deal of luck involved to prevent the #1 team in the league from winning more than 13 or 14 games each year. Otherwise, why wouldn't the best team win 16 games every year?
In this post, I'll compare the actual distribution of NFL season wins to the distribution of a league determined by pure luck. Next, I'll compare the actual distribution to a league that theoretically is based on pure skill. Then finally, I'll show how I mathematically synthesized those two comparisons to determine exactly how much of the NFL is really just luck.
WHAT I MEAN BY LUCK
I'm not talking about a freak gust of wind or a slick patch of turf at a critical time and place to alter the outcome of a game. Although things like that happen, I'm talking about a much more ordinary phenomenon. An example I've used before goes like this:
Consider a very simple example game. Assume both PIT and CLE each get 12 1st downs in a game against each other. PIT's 1st downs come as 6 separate bunches of 2 consecutive 1st downs followed by a punt. CLE's 1st downs come as 2 bunches of 6 consecutive 1st downs resulting in 2 TDs. CLE's remaining drives are all 3-and-outs followed by a solid punt. Each team performed equally well, but the random "bunching" of successful events gave CLE a 14-0 shutout.
The bunching effect doesn't have to be that extreme to make the difference in a game, but it illustrates my point. Natural and normal phenomena can conspire to overcome the difference between skill, talent, ability, strategy, and everything else that makes one team "better" than another.
For more on how I define luck, see this post.
A PURE LUCK LEAGUE
What if the NFL was 100% luck? By that I mean, "what if the winner of each game was determined as if it were a flip of a fair coin?" The binomial distribution gives us the answer. The distribution mimics a bell-curve normal distribution. The graph below is a histogram of season win totals in a pure luck league.
As we'd expect, it illustrates that in such a league with 16 games, 8 wins would be the most common season outcome. About 20% of all teams would finish 8-8. About 5% of all teams would finish 11-5 and another 5% would finish 5-11. Almost no teams would finish undefeated or winless (each having a 0.00002 probability).
This type of league represents perfect parity. Every team has exactly a 50% chance of winning each game. To spectators (and NFL analysts) however, it would still appear that some teams are "better" than others. Some teams would even appear "hot" because they won several games in row, when in reality it's just an artifact of luck. (Sometimes when you flip a coin you get heads a few times in a row.) Does the coin have momentum? Is it hot? Some coins would have an above average number of heads several seasons in a row. Is that coin a dynasty?
But the real question is: How does the actual distribution of NFL regular season wins compare to the hypothetical luck league? How different is the observed distribution from an idealized distribution of pure luck? The histogram below shows the distribution of the actual NFL regular season win totals for every team since 2002, when the current division structure and scheduling system began. It's slightly irregular because it represents just five seasons (160 team records).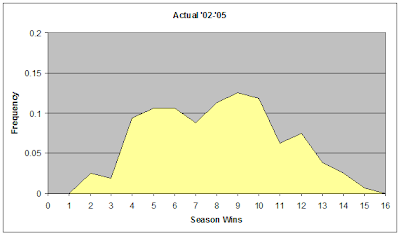
9-7 turns out to be the most common W-L record, followed by 10-6. I didn't expect that. At first, I thought I had discovered something interesting in the "dip" that the distribution takes at 7 wins. I thought that it was evidence that, even more often than we'd expect, teams with playoff hopes usually beat teams with nothing to gain at the end of the season. This effect would result in extra occurrences of 10-game winners. But after running many simulations of random sets of five seasons, irregularities like that were very common by chance alone. (More on that later.)
Let's compare the two distributions--pure luck vs. actual. The next histogram shows both distributions together, and at the same relative scale.
So how different are the distributions? Statistically, they are absolutely not similar. The goodness-of-fit test for two distributions is the chi-square test. It tells us it is infinitesimally unlikely that the actual distribution is sampled from the binomial distribution (p=8.9E-34). But that is obvious enough by just looking at them. To me, it looks like the actual distribution is a flattened version of the binomial distribution. It's as if something is "squashing" the luck distribution to create the actual distribution.
By comparing the two distributions, we can calculate that of the 160 season outcomes, only 78 of them differ from what we'd expect from a pure luck distribution. That's only 48%, which would suggest that in 52% of NFL games, luck is the deciding factor!
To me, that was too hard to accept. Frankly, I didn't buy it, so I kept at it. In part 2 of this article I'll re-attack the question from the opposite direction. I'll compare a theoretical "pure skill" league with the actual NFL win distributions. We'll see that it's skill that's "squashing" the luck into the actual distribution.


Neat post. I am curious though - what exactly is included in skill? Agility, quickness, 40-yard dash times, strength...those kinds of things that are quantifiable? What then is included in luck? Bounces of the ball, stuff like that.
I think there is a third category that falls outside skill and luck - the "intangibles", the things that are mostly mental and can't be assigned a value. Mental toughness, motivation, health, etc. They have to be accounted for, otherwise the analysis is incomplete. They're skills, but they can't be quantified. They're definitely not luck, as they are skills that have to be developed.
I'm not doing a regression of 40 yd sprint times or bench press reps. I'm not basing it on regression models or correlations at all.
You'll see more when I'm able to post the rest of the study. Basically I just need to know what the win distribution of a theoretical skill-only league looks like. By a skill-only league, I just mean no luck is involved in determining the winner. The better team always wins, and there would never be an upset.
See my original post regarding an example of what I consider luck.
The rest of my comment is not relevent to this post, but I'll respond to your points.
About intangibles. I don't disagree they exist, but their effect would show up in the performance stats, would they not? Additionally, I believe the things commonly referred to as intangibles tend to be over-emphasized. People see an underdog upset a favorite and naturally need to create a reason.
I'd also consider injuries as luck. People commonly say "injuries are part of the game." That is completely untrue, of course.
Injuries are a reality of the game. They are a consequence of the game, but they are not part of the sport. Injuring an opponent is not an objective. It is not rewarded and players frown on it. But when injuries are intential, or even appear intentional, the culprits are penalized, fined, and suspended.
Hard hits are part of the game. Shaking someone's confidence and their will to fight is part of the game, but intentionally endangering their career is certainly not. Causing injury is not a planned, repeatable, practicable skill or talent within the rules of the sport.
Okay, I see where you're going with this...I'll wait to see part II before I say anything else.
First, I think it's important to point out that the "best" computer models had a test set of only 2 weeks. From what I've seen, it's not terribly difficult to find 2-week periods of very high predictive success.
By DVOA standards, the overall better team wins about 63% of the time, but that total varies significantly from year to year.
<Bee in bonnet>
To me, intangibles fall partially into the same category as luck and partially into the same category as skill. We're using averages to predict future performance, but players perform above and below averages due to foreseeable factors (pre-game injury, opponent quality) and nonforeseeable factors (in-game injury, random bounces of the ball, death in the family). When Brett Favre's father died, if he had choked in the Oakland game, people would've said he was distracted and shouldn't have played. But he played so well that it seemed as if he were especially motivated. I'm somewhat in line with the Le Batard school of thought that results dictate perceived intangibles.
That's not to say intangibles do not exist, however. If a player is especially motivated throughout the season (e.g. contract year), it should show up in his performance metrics as an abnormal spike. If a team chokes in big games, it should show up as an abnormal drop in *opponent-adjusted* statistics. If a team is out of shape and not motivated, it will show up in their performance (see the 2006-7 Miami Heat).
</Bee in bonnet>
I know this is an old post, but I've just stumbled upon your site. It has been a pleasure reading it, btw.
Just a question - it appears to me from your graphs that the most common record is 9-7 followed by 10-6, and not 10-6 followed by 9-7 as you stated. Am I mis-reading your graphs? The 9-7/10-6 scenario feels more intuitively obvious to me.
Keep up the great work on the site! (and I hope your week 12 probabilities for the Chargers vs. Colts proves accurate. GO BOLTS!)
Fred-You're right. Thanks for the correction.
Another potential problem with this study is the assumption that all teams are trying to win every game. Teams that have locked up home field advantage in the playoffs sometimes tend to play any remaining regular season games like a pre-season games, resting some key players and pulling out most starters in the second half. I don't think this is a good strategy because of the effect it can have on the mentality of the team but some teams do it and it is definitely another factor besides luck that explains why the best team doesn't always win every game.
I also think it would be interesting to see a study on how expected points from a given point on the field change between regulation and overtime and a study on what correlation there is between winning or losing streaks and the probability of winning the next game. If there are already articles on this please direct me to them or if those are just things that would not be worthwhile to study I'm sorry, I'm new to this site and not a big statistics buff but I'm learning a lot from the site, I love it.
Yes, it assumes teams are trying to win games.
Brian;
This is your seminal work. Brilliant!
I still don't feel even us hardcore stats
gurus have digested the consequences of your findings.
1) If my logic is sound does it follow from a 48% skill NFL league, that each observation (1 game in a 16 game league) contributes only 3% towards the 'skill bank' so to speak.Or rather our certainity in the skill stats we observe.
In other words, if you were to only watch ONE of a team's game one would only have 3% confidence in the results that they were skill-based because that team was better/worse than other.
(Even NE blowout of TENN)
Maybe one can't simply divide the skill per game
is there a proper formula?
What would happen if the nFL played 32games?
what do you think the graph would look like? how much would the team wins look more like skill league?
keep up the great work!
Joe
I've always felt like luck played a big role. For instance, take fumbles and tipped balls. The players themselves can cause these actions, but whether they actually result in a turnover usually involves a great deal of chance.
A couple of years ago I looked at fumbles lost and one team (TEN I think), fumbled 20+ times, but only lost 2 or 3. Conversely there was one team (Ravens I think) that recovered more fumbles than they actually forced. Typically these numbers were around 50%.
Likewise penalties are a bit of a wild card. For example, on 3rd and goal a team defends a pass in the endzone, but is called for an iffy PI. If that play was run a hundred times, maybe 50% of the time it's a penalty. So half the time the opponent will line up for a FG, and half the time they will line up for 1st & G at the 1...with a very high chance of scoring a TD.
So that penalty probably has a 3.5+ point swing (assuming not every 1st & G gets a TD). In a perfect world there would be a penalty based on exactly how bad the PI was...maybe in a case like this it would be half the distance to the goal and repeat 3rd down.
I'd also guess that penalties against the offense probably have the most effect given that increased down and distance probably greatly increases the chance of punting.
Conversely, a foul on the defense often gives a first down, but it also resets the down and distance. So the offense does benefit, but the benefit varies based on what the prior offensive situation was. If the defense goes offside on 2nd & 1, the actual penalty isn't really that great.
Hi Brian;
I used your approach to check for the level of skill/luck in the nhl (my fav. sport)
Unfortunately i don't know how to compare
graphs via chi test? Can you match distributions by checking the SD .
for example actual sdw% nhl last 5 seasons
(150 team seasons) is .083
my all luck (nhl)league has a sd w% of
0.053
my skill league sdw% is (.29)
my 40% skill league sdw% is (.145)
my 30% skill league sdw% is ( .10)
my 20% skill league ....(.073)
my 24% skill league ....is .083
therefore nhl is 24% skill 76% luck
and best predicition model can achieve
62%correct (24%+38%...half of luck)
is this reasoning sound? did you have another way of calculating luck of a league
thanks Dan
Injuries, refs, and turnovers. Three things you can't predict. To me it usually determines success and failure.
It seems to be that skill and luck (as defined as everything not skill) are not independent events. Everything not skill is not luck and possibily they are interactive. Such as causing a fumble is a function of tackling techniques, even a PI call at the goal line has a small percent of skill as some veterans know how to "push" a receiver and not be flagged. I think a better theoretical model is not to think of them as independent events but that skill causes more luck and therefore there is a compounding effect. Each play has some percent of luck and skill. But over a 130 play game luck becomes less a factor in the overall score than a single play. for example if a HS team played the Ravens they would probably lose ad infinitum in the final score (unless all were killed in bus accident on the way to the game) but probably could make on first down in a game demostrating a skill effect or luck in one play. It is the large n of plays across a season that flattens the distribution.