
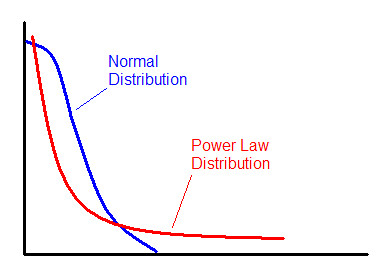
 Most of the analysis I do at this site is based on the normal distribution (aka Gaussian aka bell curve). Team records, yards per attempt, sack rate, turnovers, and just about everything else follow a bell curve distribution where most teams or players are bunched around the average and a rapidly diminishing number are found at the extremes. Most of the statistical tools used here such as regression, correlation, or even simple averages are based on the assumption of a normal or quasi-normal distribution.
Normal distributions are ubiquitous in sports for mainly two reasons. First, the rules provide level playing fields, fixed boundaries, and predictable cause-effect relationships. Football games always last 60 minutes, the field is always 100 yds long, a touchdown is always 6+ points, and a win is always a win no matter how close the score. Second, there is a significant amount of random luck involved in sports, which by definition is always distributed normally.
Other distributions with different shapes appear in sports. Recently I looked at how sports like soccer, lacrosse, and particularly hockey are better modeled with Poisson distributions.
There are other distributions that often appear in nature and in sports that are completely unlike the bell curve most of us are familiar with. The power law distribution is a prime example.
The Power Law
Have you ever noticed how most of the productivity around your office seems to be accomplished by a minority of your co-workers? It’s no different in the NFL, or most anywhere else.
The power law is all around us, and is a fundamental property of natural organizations of all types. City sizes, for example, are distributed according to the power law. There are a few extremely large cities, more average sized cities, and very many smaller towns. Earthquake sizes, the structure of the Internet, stock market gains and losses, body mass indexes, gravity, social network connections, wealth distributions, and even Kevin Bacon movies all follow power law distributions. If you've ever heard people refer to the "fat tail" or the "long tail," this is what they're referring to.
The power law distribution follows this equation:
where x and y are variables and a and b are constants. The constant b is known as the scaling exponent.
 The Financial Crisis
Our current financial crisis was in part caused by a fundamentally wrong assumption about risk distributions in the debt markets. An oversimplified explanation is that investment companies made lucrative but risky investments, and then hedged against their failure by buying insurance in the form of complex derivatives in case they went bust. These companies thought that they had cracked the code and solved the problem of risk once and for all. (One of the reasons the company AIG is central to the problem is that it's the company that led the selling of all that insurance.)
The problem was that the insurance was priced based on an assumption of bell curve distributions of market risk. A model known as the Correlated Gaussian Copula was developed by a Chinese mathematician named Li, and it was widely used throughout the financial industry for measuring and pricing risk. Unfortunately, financial markets act more like earthquakes than normally distributed phenomena like rainfall or human height. There are lots of minor fluctuations but occasionally the bottom drops out. The power law distribution has a ‘fatter tail’ at the extremes than the normal distribution, meaning extreme outcomes are considerably more likely.
Network Organization
One reason we see power law distributions so often is because they are a signature of networks. The picture below could represent a computer network, a social network, highways between cities, or airline routes. But let’s say it represents business connections among individuals. If you’re an entrant into that business market and had the resources to afford to establish a single link, who would you prefer to hitch your wagon to?
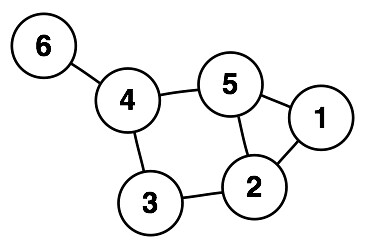 I’d want to be associated with someone who is already well-connected. I’d want to connect to #4 or #5. Each already has 3 connections and is no more than 2 degrees removed from any other member of the community. I’d avoid #1 and especially #6. They have fewer connections and are further removed from the rest of the group.
This process tends to enrich nodes that already have a large number of links. Once the decision is made to link to either #4 or #5, that node would now be even more attractive to subsequent entrants. In organizations like this, the number of links for each node follows the power law distribution.
Scale Invariance
The fundamental feature of power law distributions is ‘scale invariance.’ For example, if you count cities of a certain size, cities half has large might be four times more common, and cities twice as large might be four times less common. If this pattern holds throughout the full range of cities, then you have scale invariance. This relationship means there is no typical city size. There will still be an arithmetic mean, but it won’t actually be the ‘average’ the way we understand it. There really is no average.
Success in College Football
What does any of this have to do with football? First, compare the NFL with college football. Think of the teams as strongly-linked clusters of individual players and coaches in the network of the overall league. The teams themselves are in turn linked and clustered by division or conference.
In college ball, elite players choose their team largely on their own, and it’s no surprise that they select their team based on the team’s current strength and the prominence of the coach. Players who aren’t recruited by the USCs and LSUs of the world will still prefer PAC 10 or SEC teams. And failing that, they’ll prefer any Division IA (or “Bowl Series”) school to the lower divisions and conferences.
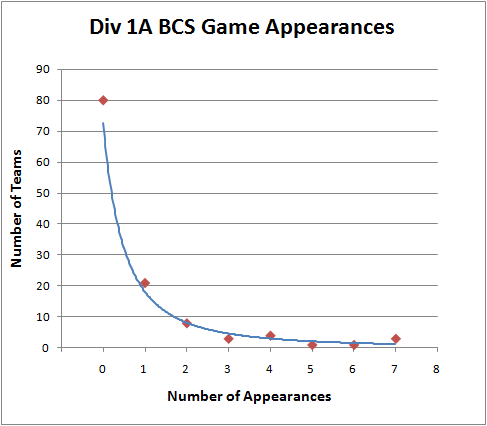
The NFL is constructed differently. With the salary cap and the draft, the better players are distributed more evenly throughout the league. Its distribution of championship appearances is decidedly not a power law distribution. But BCS appearances by college teams certainly is:
Pro Bowl Selections
What does follow a power law distribution in the NFL is Pro Bowl appearances. Just like in your office where a minority of employees can account for most of the productivity, the talent in the NFL is distributed in a similar way. In doing my analysis for drafting defensive backs I noticed just how much Pro Bowl selections were concentrated among the top players.
Among all the defensive backs drafted from 1980 through 2001 who have had at least one year as their team’s primary starter, the distribution looks like this:

There are plenty of players with no appearances, a smaller group with 1 selection, and then a steadily decreasing number of players with 2, 3, 4, etc. selections. As you can see, the distribution approximates a typical power law distribution.
Here is the distribution for QB Pro Bowl selections. It approximates a power law distribution even better.
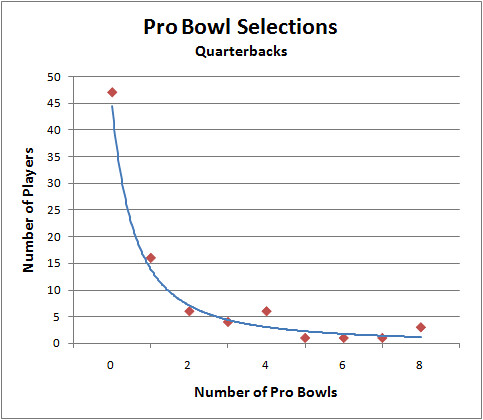
What does this tell us about Pro Bowl selections? Does this mean that being chosen for the Pro Bowl is based on how connected a player is? Partly--because the votes of other players and coaches weigh heavily in the selections, but that’s not what I’m getting at. Besides raw performance, it also depends on how popular the player is, how good the rest of his team is, how often the team plays on national TV, and how good he was in previous years. And all those things are correlated with each other--it's a complex self-organizing system of factors and influences. That’s one reason why we see the power law at work here.
Coaching Tenure
Another example of the power law in football is the tenure of coaches. This paper from the UK found that coaching tenure in the Premier League follows a power law very closely. They even looked at NFL coaching tenure and found the same pattern. I’ve done my own analysis and confirmed that coaching tenures in NFL obey the power law distribution. What the researchers conclude is that talent and ability has relatively little to do with how long a coach hangs on to his job. It mostly has to do with being ‘sacked’ or ‘poached,’ and with the random luck of his team. (For instance, Jon Gruden was poached from Oakland and sacked at Tampa Bay). Interestingly, the tenure of leaders of many kinds including Popes, British Prime Ministers, and Roman Emperors follow power law distributions.
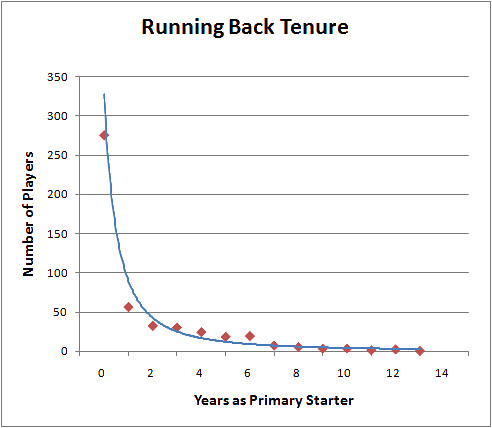
Player Tenure
Although career length does not follow a power law distribution, years as a starter does. For example, of all the RBs drafted between 1980 and 2000, the majority will never be a starter, and the rest of the players have steadily decreasing chances of lasting long as a starter. Here is the distribution:
Why Any of This Matters
Power law distributions are noteworthy because they are the signatures of mature self-organizing complex systems. It’s also a feature of ‘rich-get-richer’ systems. So when we see power law distributions, we can make some qualitative inferences about the system we’re observing. For example, the BCS system is certainly a rich-get-richer organization. We can even quantify just how hierarchical it is and how difficult it is for second-tier teams to break into the elite.
The problem with the BCS isn’t just that it’s a rich-get-richer system. That’s just the natural way of the world. Even in supposedly ‘egalitarian’ systems like socialism, the rich still get richer. The difference is that initial outcomes in socialist systems are based primarily on one’s political connections, where in a free market they tend to be based on how productive or innovative one is. The problem is that the elite ‘nodes’ of the BCS have colluded to preserve their status on top, preventing a natural churn in who the elite are.
Understanding the implications of power law distributions also helps make more accurate models. For example, there really isn’t an average coaching tenure, and the standard deviation of tenure is not a meaningful statistic. Instead of applying the normal distribution and its associated analytical tools to everything we see, we should be more cautious.
If anyone is interested further in network theory and power law distributions, I recommend the book Nexus: Small Worlds and the Groundbreaking Theory of Networks. Regarding the current financial crisis and the misapplication of risk models, I recommend this prophetic 2005 WSJ article.


Well put. The power law applies to a lot of things. It is also present when you look at a plot of fantasy points per player. One player always stands out the most every year and it drops off sharply after that.
It reminds me of when a coached talked about the NCAA men's basketball Top 25 Poll. He said that just as hard is it to get into the Top 25, it's just as hard to get out.
Good point. The graphs of fantasy point distributions in this article are probably power law curves.
I think I tried to fit log curves to them though.
Nice overall, although the aside about socialism is a poor addition to the article. If you want to get serious about economics, that's one thing. However, to tack on a highly tangential and unsupported claim as you did comes across as rather crass propaganda.
Thanks for the suggestion, Fidel.
Interesting post, though I was hoping you were going to go somewhere a little more interesting with it.
I have to agree with "Fidel" here, that little tangent didn't add anything to the post. I'd be curious to know why you felt the need to include it.
I know the feeling. I ws kind of hoping I'd get more interesting comments. Since you 'felt the need' to ask...
The rich-get-richer phenomenon is frequently used as a knock against the free market. But in truth it's a characteristic of all self-organizing systems, whether it's the NCAA or a socialist economy.
One of the best football articles I've ever read. Thanks for this Brian.
Did you write this after reading The Black Swan? This sounds very Taleb?
if nfl not power distribution, why have detroit lions been so bad for so long? I guess you forgot the dumbass factor.