
 In a post from last year I noted how team records tend to regress to the mean from year to year based on how well a team did regarding interceptions. When teams did notably well in either offensive (low) or defensive (high) interceptions, the overwhelming trend was for them to win fewer games the following year. Likewise, teams with poor interception stats tended to win more games the following year.
When we look at team records from year to year, regression to the mean dominates. Good teams win fewer games the next year, and bad teams win more. This tendency is extremely strong as illustrated by the graph below. The horizontal x-axis represents each team's regular season win total from the prior year. The vertical y-axis is the change in each team's win total from the prior year to the subsequent year. The more wins a team had, the farther the drop in the following year. Likewise, the fewer wins a team had, the stronger the improvement. For example, the typical 13-win team will tend to win 4 fewer games the following year. And the typical 4-win team will tend to win 3 more.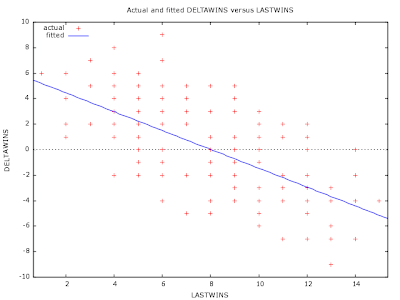 I previously attributed the strength of the regression phenomenon to the scheduling system which matches opponents according to how they placed in their respective divisions, the draft which allocates draft position in reverse order of win-loss records, and salary cap boom/bust cycles in which individual teams load up on talented and costly players, then 'purge' their rosters to recover salary cap room for the dead weight of past signing bonuses.
While those considerations are very likely to contribute to the churn of team records, I now believe the major cause is the randomness of turnovers. Each team's turnover stats have a random component--think of tipped passes or fumbles bouncing on the turf. To test how strongly turnovers drive the phenomenon of win regression, I calculated the correlations between each turnover stat and the year-to-year change in team win totals (Win Δ). The data is from all 32 teams' five season-pairs from the 2002-2007 regular seasons (n=160).
| Stat | Win Δ Correlation |
| Int Taken | -0.34 |
| Fum Taken | -0.10 |
| Net Takeaway | -0.32 |
| Int Thrown | 0.36 |
| Fum Lost | 0.25 |
| Net Giveaway | 0.38 |
| Net TO | -0.47 |
These are very strong correlations, considering we are estimating next year's wins with previous year's stats. It's important to point out these are inverse correlations. The better a team does in terms of turnovers one year, the fewer games it is expected to win the following year. To put this in context with other correlations in the NFL, current year TD passes correlate at 0.50 with current year wins.
Based on each team's 2007 turnover stats we can estimate their improvement or decline for 2008. The estimates are based on a linear regression on Win Δ by fumbles lost, fumbles taken, interceptions thrown, and interceptions taken. Those teams that benefited the most from favorable turnover stats would be expected to decline, and vice versa. The table below lists each team and their expected change in wins from 2007 to 2008.
(One caveat--these are not definitive predictions for 2008, these are just based on the overwhelming tendency for teams to regress based on turnovers. Think of these as estimates about which other factors, such as injuries and fundamental improvement or decline, would operate.)
| Team | Int Taken | Fum Taken | Int Thrown | Fum Lost | Net TO | Exp Win Δ |
 HOU HOU | 11 | 14 | 21 | 17 | -13 | +3.0 |
 BAL BAL | 17 | 6 | 14 | 26 | -17 | +2.3 |
 SF SF | 12 | 10 | 17 | 17 | -12 | +2.2 |
 STL STL | 18 | 9 | 28 | 9 | -10 | +1.9 |
 KC KC | 14 | 8 | 20 | 13 | -11 | +1.8 |
 OAK OAK | 18 | 8 | 20 | 17 | -11 | +1.6 |
 NYG NYG | 15 | 10 | 20 | 14 | -9 | +1.6 |
 ARI ARI | 18 | 11 | 24 | 12 | -7 | +1.4 |
 NO NO | 13 | 10 | 18 | 12 | -7 | +1.3 |
 PHI PHI | 11 | 8 | 15 | 12 | -8 | +1.2 |
 DET DET | 17 | 18 | 22 | 14 | -1 | +1.0 |
 MIA MIA | 14 | 8 | 16 | 13 | -7 | +0.9 |
 CHI CHI | 16 | 17 | 21 | 13 | -1 | +0.9 |
 WAS WAS | 14 | 10 | 11 | 18 | -5 | +0.6 |
 CAR CAR | 14 | 16 | 17 | 12 | 1 | +0.4 |
 CLE CLE | 17 | 10 | 20 | 9 | -2 | +0.3 |
 NYJ NYJ | 15 | 6 | 19 | 6 | -4 | +0.3 |
 DEN DEN | 14 | 16 | 15 | 14 | 1 | +0.3 |
 MIN MIN | 15 | 16 | 14 | 16 | 1 | +0.2 |
 PIT PIT | 11 | 14 | 14 | 8 | 3 | -0.2 |
 TEN TEN | 22 | 12 | 17 | 17 | 0 | -0.2 |
 CIN CIN | 19 | 16 | 20 | 10 | 5 | -0.4 |
 ATL ATL | 16 | 12 | 15 | 9 | 4 | -0.7 |
 DAL DAL | 19 | 10 | 19 | 5 | 5 | -1.1 |
 GB GB | 19 | 9 | 15 | 9 | 4 | -1.2 |
 BUF BUF | 18 | 12 | 14 | 7 | 9 | -1.7 |
 SEA SEA | 20 | 14 | 13 | 11 | 10 | -1.9 |
 TB TB | 16 | 19 | 8 | 12 | 15 | -2.3 |
 JAX JAX | 20 | 10 | 8 | 13 | 9 | -2.3 |
 IND IND | 22 | 15 | 14 | 5 | 18 | -3.2 |
 NE NE | 19 | 12 | 9 | 6 | 16 | -3.2 |
 SD SD | 30 | 18 | 16 | 8 | 24 | -4.2 |
Why does randomness and regression to the mean appear so strong in the NFL? I think it's due to a combination of a short schedule and team parity. Sixteen games is simply not long enough for "the breaks" to even out. And if the opponents are relatively equal in ability, then random factors will play a large role in determining game outcomes. When randomness is decisively involved, regression to the mean will be a strong force from year to year.


Brian,
If my analysis is correct, then you're headed in the right direction. We've got all but nine of the teams in the NFL headed in the same direction for 2008. The teams we disagree on (when using my analysis and your turnover/regression to the mean analysis) are:
Atlanta
Buffalo
Cleveland
Denver
Houston
New York Giants
New York Jets
Pittsburgh
Washington
Interested to see how your full analysis pans out for 2008!
Excellent ... the turnover stats are nice because (a) turnovers are so significant, and (b) there's so much luck in them. I bet it's hard to find similar stats in other sports, something that can turn the game around but is almost always random. I suppose BABIP is the closest thing we have, in baseball.
Or maybe it doesn't matter ... if you count *everything* and regress it to the mean, you get the same reliability in any sport. But a lot of things are hard to regress to the mean, because you don't know how much to regress. When a .260 hitter suddenly hits .280, you don't really know whether he improved, or whether he needs to be regressed all the way back. But with turnovers, you pretty much know.
Hello Brian, appreciate the quality of your site.
I agree on the large element luck plays in turnovers but I am not sure about the strength or direction of the relationship between wins and turnovers.
I realize you are more interested in prediction than explanation but, if you follow a team like the Bears, how do you explain turnover to win data from say 1983 to 2007.
Just eyeballing the data (I am not running regressions) there is some correlation but I am not sure how strong it is. Particularly when you see years like 1990 and 91 where in both years the Bears win 11 games but their turnovers are +19 and -3.
Also what is usually the main driver when a team has a large turnover margin---these large margins, nowdays, usually come from ints and it is weaker teams that have to play catch up in the 2nd half that tend to throw more ints and vice versa for good teams.
What does all this add up to; in all honesty I do not know
MB--I agree with your analysis regarding "catch-up" interceptions, so the direction of causation is totally clear (yet). We could look at 1st-3rd quarter turnovers only, and see if the relationships still hold.
However, there will always be exceptions, and I can't fully explain the mechanisms, but the strength of the correlations and tendencies speak for themselves. Team win totals strongly tend to regress in large part due to the randomness of turnovers. Only about 1 in 7 teams buck the trend.
In other words, if your favorite team won a lot partly due to a favorable net turnover margin, expect a 6 out of 7 chance that they'll win fewer games.
Thanks for the comments Brian.
Carroll, Palmer, and Thorn wrote a whopping 3 pages about turnovers in The Hidden Game. Epstein had 1 paragraph in his book Dominance. Are you aware of any fuller treatment of the topic?
Considering how many coaches believe success and failure hinge on turnover margin I suspect there must be some research on it floating around.
My previous comment should have read "...is not totally clear, yet."
Most of the work done on turnovers is focused on the yardage or point equivalent of a turnover.
Football Outsiders' did some good stuff, basically applications of C,P & T. I believe Doug Drinen at Pro-Football-Reference.com did some things too. The Romer paper on 4th down decisions and the Passing Premium paper also discuss them. The basic consensus is that a turnover is worth about 45 yards or about 2 points.
I've done some of my own stuff. I did a study of fumble recoveries, which showed they are very random. Also, check out my 'signal vs noise in football' and 'explanation vs. prediction' articles if I haven't linked to them already.
I suspect Mike Martz might have the right idea (emphasis on might). Coaches are so focused on turnovers, possibly at the expense of optimum play-calling. But most of them are simply part of the game. The only way to have zero turnovers is to punt on first down.
I think you hit the nail on the head with this analysis. I had looked ant the regression between total wins and a number of factors for the 2006 season.
Other than points per game (and a few related stats like TD's per game), the strongest correlation to wins was net turn-overs at 0.73. You get one extra win for every 4 net turnovers; the st dev for net turn overs was just over 8. So a team 1 st dev above the mean would win 2 extra games; a very luck team would win 4 or 5 extra games.
This corresponds exactly with your regression line:
* most team change by 1-2
* a few change up to 4
* hardly any change by 5 or more
The flip side of this is that a "good team" is expected to win no more than about 12 or 13 games. A bad team is expected to lose no more than 3 or 4. In other words, parity in the NFL is such that no team is "great enough" to deserve to win 14+ games; not team is "pathetic enough" to deserve to win 2- games.
Any teams outside these limits are almost certainly good team (or bad team) and ALSO lucky (or unlucky).
Tim F
Just read this with interest. What comes to mind re INTs especially is that some are random eg the tipped ball, but others will be from more "genuine" (?) good defensive play eg good pass rush, good break on the ball by the DB etc. These ones are NOT random, surely? How many INTs involved a tipped ball at the LoS? I am not sure if there is an equivalent in fumbles, however.
Completely disagree with the reasons people have disagreed with your statements. Tipped balls? Honestly...
However, I would like you to put your chart on a 10-year basis like I just did. It looks like I just played darts, completely random over history. Your theory works when there are many turnovers, however high turnover eras phase in and out, and on low TO seasons this system collapses.
I really like where you are getting though. You're reaching a better place than the betting groups, actually trying to predict winners.
I will offer a very simple tip that corrects your 10-year chart quickly, and that I think makes sense (as in not just a fudge factor): Try average Time Of Possession. It doesn't help every team and season, but in general the combo wins 89% in my experience, NFL-wide.
FYI: This is a bit outdated, but it basically shows that turnovers are overvalued by bettors:
http://www.twominutewarning.com/turnover.htm
I tried a similar strategy in my "How to beat the spread" article. I had a somewhat different strategy that had mildly positive results, but at the suggestion of a commenter I stumbled upon a slightly stronger and far more consistent one.
A couple criticisms about that article. The author doesn't seem to realize that things like total rushing yards are usually a result of winning, not the other way around. In his first table, he tries to use box score stats to predict who the winner was using total yardage measures.
The main point of the article talks about comparing team "turnovers per game" instead of total team turnovers. He claims that this method is what gives his system its predictive capability. I think that's false. For most of the season, opponents have played equal numbers of games. So using total turnovers or turnovers per game is often irrelevant.
What he should really focus on is turnover rates, such as interceptions per pass attempt, or fumbles per play. Teams that are behind will usually generate more interceptions for themselves simply because they're passing more often and they're taking bigger risks.
So unless you're using rate stats, it's the winning or losing that often drive the boxscore stats, not the other way around.
Was consideration given to the effects of man versus zone defense on these numbers?
Zone defenses theoretically give you a higher chance of getting an interception as the defender has his eyes on the quarterback (and the ball) and is prepositioned in the area of the field the ball is being thrown to.
While chance has a great effect I'm not sure I believe that turnovers are purely random.
mlc0808
Sure, but man coverage usually goes hand in hand with a blitz/dog. So there is more pressure on the QB, which can also contribute to a higher likelihood of an int.
While the type of coverage would certainly play a part in explaining what causes interceptions, that was not the point of this analysis. My only goal was to measure how consistent it is and not what causes it.
I wouldn't say "purely" random either, just mostly random, or far more random than any other stats. They appear to be driven far more by who is throwing than who is defending.
Since when is a correlation .38 or below a strong correlation? It sounds marginal at best.
An r of 0.38 is never marginal in any respect, unless the sample size is extremely small, which is not the case here.
I say it's strong because it's the correlation between a past-year stat and the following year's wins. If you consider that last year's wins auto-correlate with the follow year's wins at 0.50, 0.38 is quite considerable.
I don't buy the premise that r values are always weak, moderate, or strong based on strict absolute bands, such as 0.10...0.20 = weak, 0.20...0.40 = whatever (like they try to teach in intro stats classes). R values always have to evaluated based on the context of the two variables.