
 This post will explain the concepts of Expected Points and Expected Points Added. In future posts when I refer to these stats, I'll link here.
Football is a sport of strategy and decision making. But before we can compare the potential risks and rewards of various options, we need to be able to properly measure the value of possible outcomes.
The value of a football play has traditionally been measured in yards gained. Unfortunately, yards is a flawed measure because not all yards are equal. For example, a 4-yard gain on 3rd down and 3 is much more valuable than a 4-yard gain on 3rd and 8. Any measure of success must consider the down and distance situation.
Field position is also an important consideration. Yards gained near the goal line are tougher to come by and are more valuable than yards gained at midfield. Yards lost near one’s own goal line can be more costly as well.
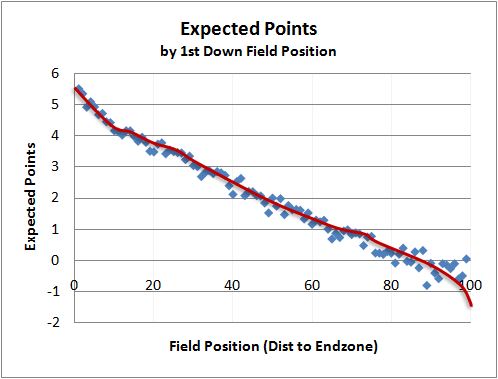
We can measure the values of situations and, by extension, the outcomes of plays by establishing an equivalence in terms of points. To do this we can start by looking back through recent NFL history at the ‘next points scored’ for all plays. For example, if we look at all 1st and 10s from an offense’ own 20-yard line, the team on offense will score next slightly more often than its opponent. If we add up all the ‘next points’ scored for and against the offense’s team, whether on the current drive or subsequent drives, we can estimate the net point advantage an offense can expect for any football situation. For a 1st and 10 at an offense’s own 20, it’s +0.4 net points, and at the opponent’s 20, it’s +4.0 net points. These net point values are called Expected Points (EP), and every down-distance-field position situation has a corresponding EP value.
Suppose the offense has a 1st and 10 at midfield. This situation is worth +2.0 EP. A 5-yard gain would set up a 2nd and 5 from the 45, which corresponds to a +2.1 EP. Therefore, that 5-yard gain in that particular situation represents a +0.1 gain in EP. This gain is called Expected Points Added (EPA). Likewise, a 5-yard loss on 1st down at midfield would create a 2nd and 15 from the offense’s own 45. That situation is worth +1.2 EP, representing a net difference of -0.8 EPA.
We can value turnovers in the same way. Suppose that on 2nd and 5 at the opponent’s 45 there was a fumble recovered by the defense. The 2nd and 5 was worth +2.2 EP, but not the opponent has a 1st and 10 on their own 45, worth +2.1 EP to them. The result of the play represents -2.1 EP for the original offense for a net loss of -4.3 EP. On average, a fumble in that situation means a net expected loss of a little more than 4 points.
To be of good use for most kinds of analysis, we need the measure of success to be linear. In this case, that means that a +2 EP is exactly twice as good as +1 EP, that +4 EP is twice as good as +2 EP, and so on. We need linearity when we analyze decisions. For example, what would you rather have a 100% chance of +3 EP, or would you rather have a 60% chance at +6 EP with a 40% chance of 0 EP? To answer this question definitively, each net point of advantage must be equally valuable to a team.
But there’s a problem. We all know that being up by 1 point at the end of a game is just as good as being up by 50. Not all points are equally valuable. Teams well ahead will sacrifice point advantages in exchange for running time off the clock, which in the end helps them win.
To mitigate that problem, the baseline EP values for each down-distance-field position situation must be created based on real game situations when points are equally valuable and time is not yet a factor. The baseline EP values are therefore based only on game situations when the score was within 10 points and in the first and third quarters. This eliminates situations like ‘trash time,’ and other distortions.
EP and EPA have a variety of applications. We can use EP to measure and compare the relative value of runs vs. passes in various situations. We can tally up the EPA for individual players and for teams for a more accurate valuation than what traditional stats can tell us. Perhaps the most useful application of EP is in the analysis of fourth down decisions, which suggests teams should be going for it far more often.
For an example of what EP values look like on first down, see the chart below. For second and third downs, see this post.
Expected Points (EP) and Expected Points Added (EPA) Explained
published on 1/30/2010


Subscribe to:
Post Comments (Atom)
I'm worried about your fits. Because for EPA you need the difference between two EP values, you're effectively taking a derivative, which is notoriously noisier than the data. The 'fit' curve above (and in your other articles, which I've read) is... messy. It looks to my eye that you could get away with a piecewise linear fit with two pieces: a "red zone" piece and the rest of the field; alternatively, a polynomial fit of some kind.
Brian,
2 things -
1. Doesn't using the historical average not take into account the strengths/weaknesses of the 2 teams playing? If I am a coach and am trying to decide whether to punt or go got it on 4th and 3 from the opponents 45 yard line, don't I need to adjust your numbers with how my team stacks up against the other team?
What I'm getting at is while having the ball on their 40 is worth 2.5 in general, against this team I think its worth 2.9 because of x, y, and z.
I don't dispute your numbers, I'm just wondering if for this to be of greater use to a coach, they need to adjust your overall numbers based on the quality of the 2 teams.
2 - might you at some point be able to post "Expected Points by 2md / 3rd/ 4th down field position"?
Thank you very much for your articles.
Brandon
Brandon,
I've developed a similar (unpublished) model that does incorporate team strength into the equations. It does change conclusions on things like punt\go decisions occasionally, but nowhere near as often as many people think.
If you have an especially weak offense, you would think that would mean you should always punt and never go on fourth down. Thats certainly the conventional wisdom. Think about what a punt really represents. You are gambling that your defense will stop the other team and that you will ultimately score when you get the ball back. If your offense is extremely weak, you have to adjust for the fact that you are less likely to score on future posssessions as well as the fact that you're less likely to convert the fourth right now. When you make both adjustments, the two factors tend to cancel each other out. Occasionally you even see counter-intuitive results (a weak offense should go and a strong offense should punt).
I have a question about the "next points" concept. So I assume if a team is on offense, and on that drive they score a field goal, the next points would be 3 for all of those plays. However, if they score a touchdown, does that count for a 6 no matter what, a 7 no matter what, depending on what happens on the extra point try, or is it an average of how many points a touchdown is worth(which I'd guessing would be something a little lower then 7).
Good question. In my implementation of the EP concept, a touchdown is worth 7 no matter if they score a 2-pt conversion or miss the XP.
Actually, it's 6.3 for all TDs, and it's 2.3 for all FGs. There has to be a kickoff to the other team after the score (except at the end of the half). The value of the kickoff is -0.7 because the value of a 1st down at a team's own 29 (or so) is 0.7 EP.
I like it...just one comment: I think you may be counting the value of a turnover slightly wrong. In your fumble example above, you state the value for the offense (let's call this Team A) is +2.2 EP, and when the fumble happens the defense (Team B) takes over with an EP of +2.1, so the net value is 4.3.
Your computation of 4.3 above actually assumes that Team B's next drive is worth 0 before the fumble happens. Their next drive actually has value - we can compute where we expect to start their next drive given where Team A currently has the ball. Let's say we calculate that we expect Team B to start their next drive at their own 29, for an EP of +.7. The value of the play would be:
(Team A drive value after - Team A drive value before) - (Team B drive value after - Team B drive value before) = (2.2-0)-(.7-2.1) = 2.2 - (-1.4) = 3.6.
Hi Mark,
Interesting. But isn't the value of the opponent's next potential drive already baked into the present EP value of situation? The way I did EP, that +.7 EP value of a following drive is already accounted for in the present value of all possession situations. I know I'm not being clear, but does that make sense?
What about Matt Cassel's EPA, it's pretty awful, how would you explain him?
Hey Brian,
How are you accounting for future drives in the EP value? When setting up your system, what was your dependent variable (ie what did you regress against)?
If you regressed against (a) points on the drive, then my statement above makes sense. But you could have regressed against something else - for example (b) points on this drive minus points on opponent's next drive. In that case - yes, you've already accounted for it. Case b has some different properties - for example, scoring a TD wouldn't result in an EP of +7.0 - it would be more like 5.8.
The way I did it is very similar to the Romer paper. It's next points scored, either on this drive, the following drive, or the next, and so on. It's the next points scored for either team, positive for the team with possession, and negative for the team currently on defense.
To account for follow-on drives beyond the next score, I factored in the value of the subsequent kickoff.
simple question. i get that you calculate EP based on 'real game situations when points are equally valuable.' but this still allows players to raise their EPA in trash-time situations, right? for example, even if down by 20 points, a 40 yard pass to the other team's 1-yard line with 2 minutes remaining would still increase the QB's EPA?
just want to make sure i understand. (even if EPA gets inflated by trash-time i know there are other stats like WPA that are minimally influenced.)
David-That's correct. The framework was established based on non-trash situations only. The EPA stats reported here include all plays.
Thanks, Brian. I wonder if there's an opportunity to create a "game manager" stat for QBs. QBs who don't throw for a ton of yards or TDs but who are efficient and safe with the ball are often referred to as good game managers.
Using your stats, good game managing QBs would be those whose WPAs are disproportionately high relative to their EPAs. Could be as simple as subtracting EPA rankings from WPA rankings.
I do that occasionally. It really doesn't tell us 'game manager' as much as it tells us 'clutch' or 'lucky'.
To measure 'game manager', I'd split WPA into positive and negative--add up all positive WPA plays and call it +WPA, and add up all negative WPA plays and call it -WPA. Then, the QBs who have the least -WPA, or have the lowest ratio of -WPA to +WPA might be our game managers.
I guess I was thinking of the QB who doesn't light it up, but who makes sure to complete the 5 yard pass on 3rd-and-4. This kind of play would increase WPA more than EPA. In contrast, garbage-time plays would increase EPA more than WPA.
On another topic, there seems to be a funny way in which QBing for a good defensive team puts a limit on WPA. If you're team never trails, there is only .5 WPA available to be earned. Whereas if your team lets the other team score first, there is a lot more than .5 WPA to be earned. And if your defense keeps letting up points, there are more and more WPA points available to be earned by the QB.
Is there a download link for the underlying graphical information in table format? I actually prefer numbers to graphs. It's the CPA in me...
Sure.
http://spreadsheets.google.com/ccc?key=0AhEXxf9odCnMdHJJd3lkUDVsX25BbUdsY2FmOUM1T3c&hl=en
I may be missing something here but you wrote that the EP for 1st and ten at your own 20 is 0.40, and then when I typed it in on the Calculator I got 0.34. Which is it?
Thanks so much, this is helping me a lot with my math paper!
It's .34. I'm sure the .40 value came from an earlier estimate.
Hi Brian, a couple quick questions.
(1) When you show Team EPA do you count penalties in the totals?
(2) What do you use for NEP when a team scores a rushing or passing touchdown? Do you use 7 or something that takes the impending kick-off into conideration (such as a NEP of 6.3)?
(3) Do you include other stats in the team total EPA's such as FG's, etc?
Thanks again.
Hi Brian -- Outstanding work. Do you have any spreadsheets that incorporate the temporal component? (ie, EV of 1st and 10 from midfield with 1:00 to go rather than in a drive that is unconstrained by the clock)? Thanks and keep up the great work. Bill (bill.porter (at) gmail dot com)
Hey Brian,
How much do the EPA values throughout the field change now that there's a new kickoff location, making TD's worth closer to 6.6 and FG's closer to worth 2.6? How often do you update the Excel sheet with all the EPA equivalents of every down-and-yardage situation?
How do you factor in (on all these stats) team variability? These are league averages and represent tactics to be used by average teams. Better/worse teams curves for EP and WP must shift and coaches must play call against the EP that is created by merging the EP's of their offense and the the opponents defense. If this is true it is naive to say the Jets should should use the same strategy as the Patriots. (I'm not saying anything you say is wrong BTW, just that there is another layer required).
HI Brian, two things.
above you refer to a field goal being worth 2.3 points, because of the resulting field position (roughly the 29). wouldn't you have to compare that to the average field position (and corresponding expected points) when NOT making a field goal?
also, and this has probably been asked before, but I notice, among others that both larry fitzgerald (a bad team last year) and Adrian foster (a good team) have NEGATIVE EPA. this just seems nonsensical, for lack of a better word.
is there a way to compare players on the same team?
for instance, what if fitzgerald's cathch rate is 10% better than the rest of his team? I don't know how this can be done (maybe not at all), but have a factor that modifies the original EPA.
it seems that the EPA, at s well as WPA makes more sense for defensive players. this intuitively makes some sense to me, in that if you have a great player on defense (say alan page), when running his way, it is going to be detrimental to the offense. (i.e., even though it matters somewhat who else is on his team, it seems that in general it would matter less (as opposed to fitzgerald being on a horrific offense last year).
Hey Brian,
While looking at the the live WP stats this weekend (and I'm fairly new to your site), I noticed that the sum of the EPA for each player on a team was significantly larger than the total points scored. Specifically, in the Colts-Texans SNF game (http://live.advancednflstats.com/index.php?gameid1=2013110310), the total EPA from both teams was higher than the real score, predicting a 48.4-47.5 Colts victory. Why do the expected values deviate from the actual values? At the end of the game, shouldn't these sum up to equal values? I understand that as the game progresses that can't be right, but at the end of the game it seems they should sum up.
Can anyone explain why that's not right?
Thanks!