
 Just before halftime in last year's Super Bowl, on first and goal from the one, Kurt Warner threw the ball directly into the arms of James Harrison who rumbled 100 yards for a touchdown. With so little time left in the half, passing was the obvious call, but that play highlights the dangers of passing so close to the goal line.
Game theory tells us that when payoffs for strategies are unequal, the strategy with the higher payoff should be chosen more often. We've seen that between the 20 yard lines payoffs for passes are consistently higher than for runs on 1st down, but inside the 20 running becomes more lucrative. Now let's take a look at the red zone in more detail, where the stakes get higher and the field gets shorter. On 1st downs in the red zone, should offenses run or pass more often, or do they already strike the right balance?
The methodology and data are identical to that used for the previous article on 1st down run-pass balance. Every down-distance-yard line situation can be expected to lead to a certain future net point advantage. For example, a 1st and 10 at midfield is typically worth 2.0 EP. A 2nd and 5 at an opponent's 45 is worth 2.2 EP. So a 5-yard gain on 1st down at midfield would produce +0.2 Expected Points Added (EPA). This method factors in risks such as sacks, fumbles, interceptions, incompletions, penalties, safeties and everything else. This analysis is limited to 'normal' football situations, when the score is relatively close and time is not a factor.
Unfortunately, the data becomes relatively thin as the field position approaches the goal line. There are fewer and fewer plays, and the data can become noisy. Drives often stall outside the red zone, or they score from beyond 20 yards out. The data for passes are particularly thin because offenses rely heavily on runs. In the previous article I grouped field positions in 10-yard bins, but inside the red zone I want to see the numbers with better resolution, so I'll use 3-yard bins. This trade-off accepts a higher degree of noise but lets us see what's going on near the goal line.
The graph below charts the EPA for 1st downs by play type inside the 20.
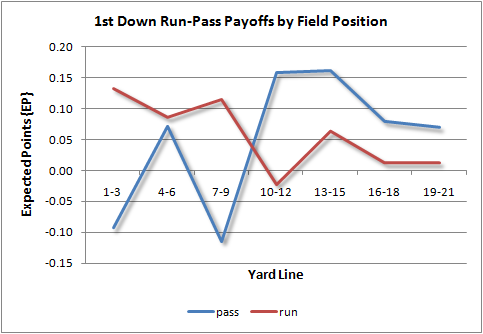
As you can tell, the numbers for passes are rather noisy inside the 10. The run numbers are far more reliable in this region. Still, if we use a really fat crayon, we can see that passes become less lucrative than runs inside the 10.
I think there are two or three mechanisms at work here. First, the compression of the field makes the defense's, and particularly the secondary's, job easier. I would suspect passes are affected by the short field more than runs. Further, inside the 10, teams no longer need a full 10 yards to be successful. Runs are typically low-variance plays in which an offense is more assured of a modest gain. If an offense is relatively assured of say, a 1 to 2-yard gain on a run, then it would have little problem scoring on 1st and goal from the 4 or 5. Lastly, turnovers become slightly more costly as a team approaches the goal line. Because passes are more susceptible to a turnover, running should be more preferred.
These effects may be true, but the real question is whether play callers are properly adjusting their play selection to account for them. Here is a graph of the proportion of play types on 1st down inside the red zone.

If you get out your ruler, you might see that the proportion of runs increases relatively steeply from the 20 to the 7-9 yard bin, then it shallows from there in to the goal line. I think the EPA imbalance suggests that the proportion of runs should continue to increase at a steeper rate inside the 10. Perhaps it should reach 85% or more at the goal line, instead of 75%.
This result is consistent with other findings that teams are passing too often in short yardage situations. In terms of conversion success and in terms of EP, runs on 3rd and short tend to be more successful.
As always, the usual caveats apply. This is a baseline for the league as a whole. Play calling is never as simple as just run or pass. There are many different types of each, but it can be useful to look play types as a whole. Additionally, there is some amount of bias in the data. Teams that are good in passing would be expected to pass more often, and teams good in running would be expected to run more often.


I wonder what the effect of play-action is in the red zone compared to outside the red zone. Is it more successful than standard passes or play-action outside the 20s because teams anticipate or sell-out for runs more than usual?
Then again, now that I think about it I believe you did an article that said the success of the running game had little to do with the success of play-action passes, so maybe not. I'd still liek to see the numbers though.
Wish I had play-action data. It would add tremendously to this kind of analysis.
Just to clarify, my feeling is that teams probably run too often for play-action to be effective. If you view the run as purely a 'jab,' that is, something that sets up passing, then teams are doing it more often than needed.
In the red zone, particularly well inside the 10, def linemen are probably selling all out to stop the run already, so play action might not buy you much.
The D-line may be selling out on the run, but my understanding is that the real benefit of the play-action is to get one of the safeties (or maybe a coverage LB) to move forward, causing a lack of double-coverage. Usually this results in no deep contain and you can hit a long pass. Of course in the redzone long passes don't exist, but the benefits of single vs double coverage certainly still apply.
I bet it is still effective, but not to the same degree since you don't have as large a variance because you can't throw an 80 yard TD from the 15.
Always wondered about this... interesting post. My feeling is that passing looks much more risky from inside the opponent's 10 because since the field is so compressed, if the QB stays in the pocket he's forced to throw more to the sidelines than the middle of the field, which results in some long INT-TD returns like Harrison's. I suspect part of what makes running more effective is how easy a FG is to make from that close, how important ball security is.
That said, I do think play-action can be a vital part of all this, given how much defenses sell out to stop the run from a few yards out. Can't say how many times I've seen a fullback or tight end wiiiiide open in the end zone... I feel like a QB rollout off play-action (like Sanchez-to-Keller in the Chargers game) is a fairly low-risk, high-reward play when everyone suspects run, since it's easy to throw/run out of bounds if nobody's open... but "passes" in general might get a bad rep because of the enormous 10-14 point swing when a more risky pass is returned all the way. As you've said, pass vs. run is not black and white, the debate is really more about aggressive vs. conservative... and while conservative should win out when the risk of a big negative-EPA swing is imminent, I think teams should take advantage more when given the opportunity to be aggressive with little risk.
Great comments.
I've always wondered about the fade route. It's a low-risk route (no sacks, very little chance for an int). It seems so common but rarely successful. It might be the kind of play that works well in practice but not in real games.
@Matt W:
I think play-action does help with a short field, but really it could have more to do with simply SHOWING run and then passing in a "run situation." If all you need is 3 yards, and linebackers are all stonewalling the goal line, one wide-open guy in the end zone is all you need to loft it over their heads for a quick score. That 5-yard pass isn't very dangerous in the middle of the field because the LBs are behind him and he'll get hammered as soon as he catches it, but here it's 6 points. That's why you always see guys you've never heard of catching 1-yard TD passes, third-string TEs and tackles and such... everyone must be covered right away on pass plays, and if they aren't, a good QB will make you pay (and a great way to leave them uncovered is have a blocker show block, like on a play-action, and then slip away unnoticed).
Similarly, though, I think it's equally important to pass once in a while... screens, fades, slants, etc... show pass, make sure the defense covers every corner of the end zone and give your RB some room to breathe when you do run.
Looking at the first graph, it appears that at about the 10 yard line ( or the 10-12 yard bin) is where run and pass have an equal EP. Given what we know about passing more on first down, there would appear to be a good rule of thumb...
1st and 10 - pass
1st and goal - run
Great stuff Brian.
Brian,
I'm with you on fades. I think they're overused unless you have a great QB and a clear height & leaping advantage, like Brady/Moss. I'd say they're used more than they should be to kind of "set up the run," drawing defenders toward the sideline... just like, as you claim, running to set up play-action is overused. It would be interesting to see how often fades are called on the most critical plays - 4th and goal and 2 point conversions - instead of 1st down.
In fact, do you happen to have data for the success rate of run vs. pass on 2-point conversion attempts? That may shed some light on what the better percentage play would be in crucial goal-line situations, when the 100-yard INT return is taken out of play.
"Perhaps it should reach 85% or more at the goal line, instead of 75%."
At the extremes you're always going to have a bias pulling things back to the middle, though, because you can't run more than 100% of the time. There will still be a few situational biases that creep in, since your selection isn't perfect: teams down 10 late in the 3rd quarter are probably optimizing more for a touchdown than a field goal, depending on how the game's gone.
Or, teams with a higher fumble propensity might choose to pass more because their average run payoff is even worse (even though their average pass payoff is still bad).
It'd be interesting to see if there are other metrics besides EP which could be altering the decision process, as well. Like possibly average points on *this* drive, touchdown likelihood on this drive, likelihood of any score on this drive, etc.
Hi Brian - Do you have any numbers for the mode of run and pass plays? I got a good sense of it from your post comparing running backs because you showed the distribution for the NFL, but can't recall anything similar for passing data. You've mentioned a few times that passing is higher variance, and that makes sense, but I'm curious how much more variable it is.
I've been looking for a histogram of yards per pass attempt, like you've done for rushing yards elsewhere, but to no avail. Obviously 0 yards would be the highest point, at around 40% league-wide, but I'm also curious what the most common pass would be, with teams averaging about 9-12 yards per completed pass. My guess would be around 6-7 yards.
Like <a href="http://www.advancednflstats.com/2009/08/comparing-running-performance.html>this one</a>? I can do that for passes.
brian,
yes! that's the one. that would be fantastic.
do you know offhand the league-wide run vs pass success rates on 2-pt conversions? haven't been able to find it, but my guess is it'd be about equal.
Runs are far more successful on 2 pt conversions.
Why coaches continue to call primarily passes in those situations is a huge question mark.
Interesting, Jeff. Do you have the numbers handy?
Between 2001 and 2008, 44.5% of pass 2 pt conversions (393 attempts) were successful. 59.7% of runs (144 attempts) were successful.
I haven't downloaded the 2009 stats yet.
thanks jeff. that is pretty interesting... i know coaches and analysts always make too big a deal about a few inches deciding whether they should run, pass, kick, etc... but you'd think they'd have numbers like this to support the argument to run it more.
this comes out to a little under 50% total... i'm sure those numbers include botched PAT attempts too, but seems like a big enough sample size where that's not really an issue.
by the way, Jeff, one more idea about why the 2-point conversion anomaly might be: i know it doesn't happen often, but it may be that teams pass more when they absolutely need a score (and would even go for 2 with a 5-yard false start, etc), but they'd be more willing to run given a better start. the numbers you give are pretty much assumed to all be from the 2 yard line, but may not be... if a defensive penalty on the PAT gives me the ball at the 1 (half the distance), i may run it because my chances are that much better.